Connie Loo
Machine Learning Journaling Micro-site

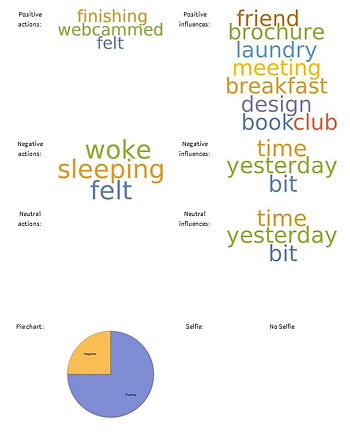
Hearty is a machine learning micro-site that outputs word clouds that show the user how much certain activities or actions may influence their mood. It summarizes how negative and positive the person's day may have been based on the sentiment detected from each sentence of their daily log. It also detects how the person may have felt in a given day based on the facial expression present in the profile picture they put in.
Microsite Link:
https://www.wolframcloud.com/objects/clloo/Hearty
How it works:
http://community.wolfram.com/groups/-/m/t/1379412?p_p_auth=YTkGj7xG
Coastal Flooding Scenario Analysis
These maps are from my final project in the GIS course, EARTHSS 134 at UC Irvine. The question I wanted to answer for the project was: "What facilities and structures are the most vulnerable to coastal flooding in the Bay Area?" This is one of the many questions that can be answered by looking at data provided by the Association of Bay Area Governments’ Resilience Program (http://resilience.abag.ca.gov/open-data/ ). This program contributes to resilience planning and policy solutions in the Bay Area community by sharing datasets about earthquakes, floods, fires, landslides, drought, and extreme heat. Because of its coastal location, the Bay Area is very vulnerable to flooding. So, it is important to consider what kinds of structures and places would be flooded in a given scenario in order to make preparations accordingly.

This is a map that shows resource facilities and structures that would be flooded in a 6-ft sea level rise scenario in the Bay Area. It includes airports, power plants, state bridges, and schools.

The color categories show which counties would have the most accessibility to emergency care facilities (in the flood scenario, but also in general). The features of emergency care facilities, fire stations, and police stations on this map include only the facilities that people would not have access to in case of a flood because they themselves would be flooded.
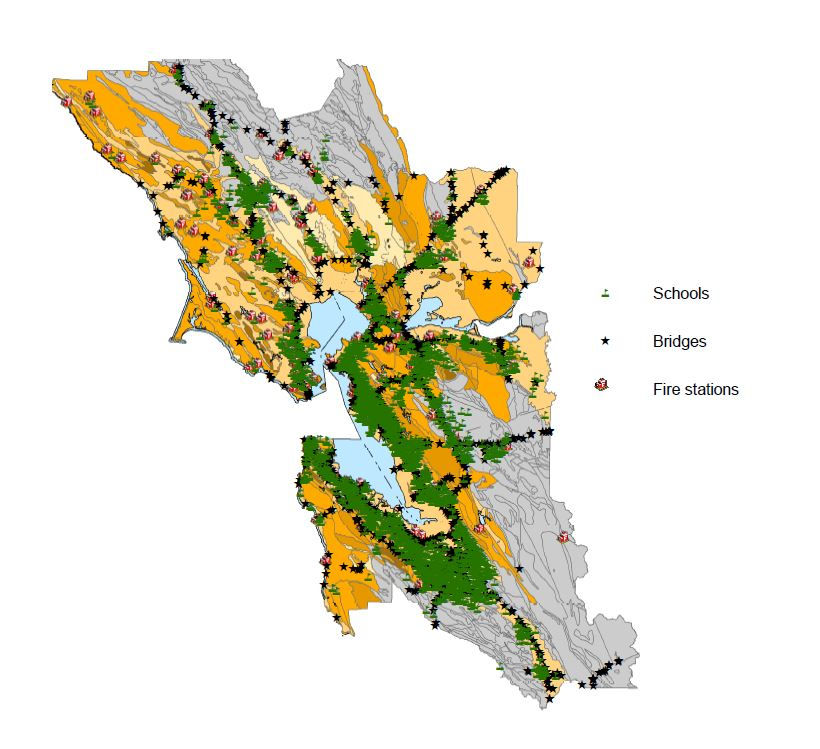
This map shows where schools, bridges, and fire stations would be in danger during a flood because of risk of erosion. It was made to be compared with the first map: Resource Facilities and Structures. One structure type that appears to be at risk the most according to both maps is schools.
This is a map that shows resource facilities and structures that would be flooded in a 6-ft sea level rise scenario in the Bay Area. It includes airports, power plants, state bridges, and schools.
Global Carbon Stock Analysis


According to the carbon stock difference map, the amount of carbon stock
increased the most in South America, parts of the U.S. and parts of Europe and Japan. It decreased the most in bits of South America, Africa and Indonesia. According to the soil moisture difference map, it looks like soil moisture increased the most in parts of Northern Canada, Mexico, Russia, South America, Africa, Asia, Indonesia and Australia. It decreased the most in parts of Africa, Indonesia, South America, the U.S. and Greenland.
There was a lot of positive and negative change in soil moisture and carbon
stock in the midlatitudes as well as bits of the U.S. and Europe. Areas outside of the
mid-latitudes also experienced significant changes. Besides the mid-latitude region, soil moisture increased the most in Northern Canada and Mexico. On the other hand, soil moisture decreased significantly in Greenland. The changes in these regions demonstrate how large a factor ice and snow have on global soil moisture because even though soil moisture and carbon stock are related in a smaller region, large areas with ice or snow probably have a dominant effect when taking the average of soil moisture across the entire world.
For further analysis, I could have looked at the correlation between only areas
that increased in soil moisture, only areas that decreased in soil moisture, only areas that increased in carbon stock and only areas that decreased in carbon stock. That may have allowed for me to identify a data set for which the r-squared value would be close to 1. Comparing maps with different color scales, conducting a t-test, or making a polynomial fit with the data may have also allowed for a more accurate conclusion.